
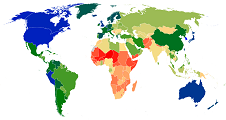
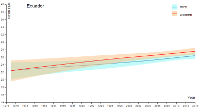
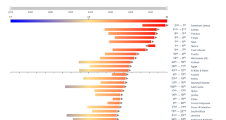
Adult Body-Mass Index
| Metrics | Map | Trend plot |
Ranking plot |
Distribution plot |
|---|---|---|---|---|
| Underweight (BMI <18.5 kg/m²) |
 |
 |
 |
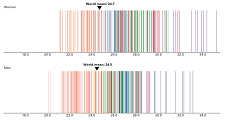 |
| Obesity (BMI ≥30 kg/m²) |
|
|
|
|
| Metrics | Map | Trend plot |
Ranking plot |
Distribution plot |
|---|---|---|---|---|
| Underweight (BMI <18.5 kg/m²) |
|
|
|
|
| Obesity (BMI ≥30 kg/m²) |
|
|
|
|